Deep Learning for Detecting Multiple Space-Time Action Tubes in Videos
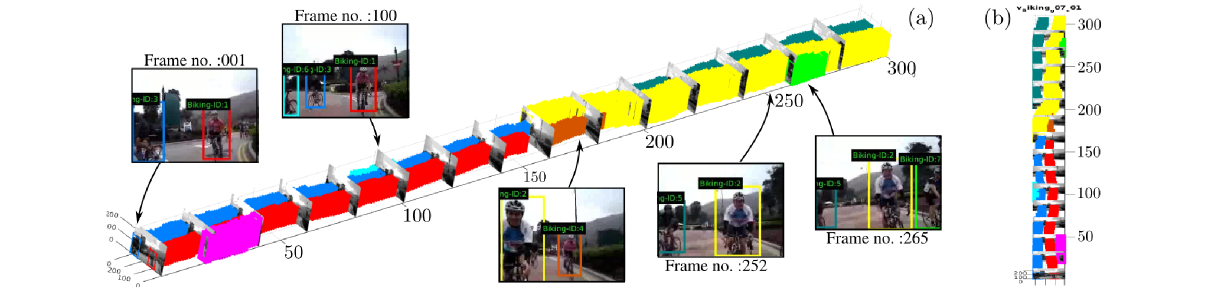
Action tube detection in a `biking' video taken from UCF-101 dataset. The detection boxes in each frame are linked up to form space-time action tubes. (a) Viewing the video as a 3D volume with selected image frames; notice that we are able to detect multiple action instances in both space and time. (b) Top-down view. Our method can detect several (more than 2) action instances concurrently, as shown in the above Fig.
Abstract
In this work we propose a new approach to the spatiotemporal localisation (detection) and classification of multiple concurrent actions within temporally untrimmed videos. Our framework is composed of three stages. In stage 1, a cascade of deep region proposal and detection networks are employed to classify regions of each video frame potentially containing an action of interest. In stage 2, appearance and motion cues are combined by merging the detection boxes and softmax classification scores generated by the two cascades. In stage 3, sequences of detection boxes most likely to be associated with a single action instance, called {action tubes}, are constructed by solving two optimisation problems via dynamic programming. While in the first pass action paths spanning the whole video are built by linking detection boxes over time using their class-specific scores and their spatial overlap, in the second pass temporal trimming is performed by ensuring label consistency for all constituting detection boxes. We demonstrate the performance of our algorithm on the challenging UCF101, J-HMDB-21 and LIRIS-HARL datasets, achieving new state-of-the-art results across the board and significantly lower detection latency at test time.
Related Publication:
Deep Learning for Detecting Multiple Space-Time Action Tubes in Videos, British Machine Vision Conference (BMVC) 2016.
Suman Saha, Gurkirt Singh, Michael Sapienza, Philip H. S. Torr, Fabio Cuzzolin.
arXiv | Paper+supplementary | Code | PosterOverview of the spatio-temporal action localisation pipeline
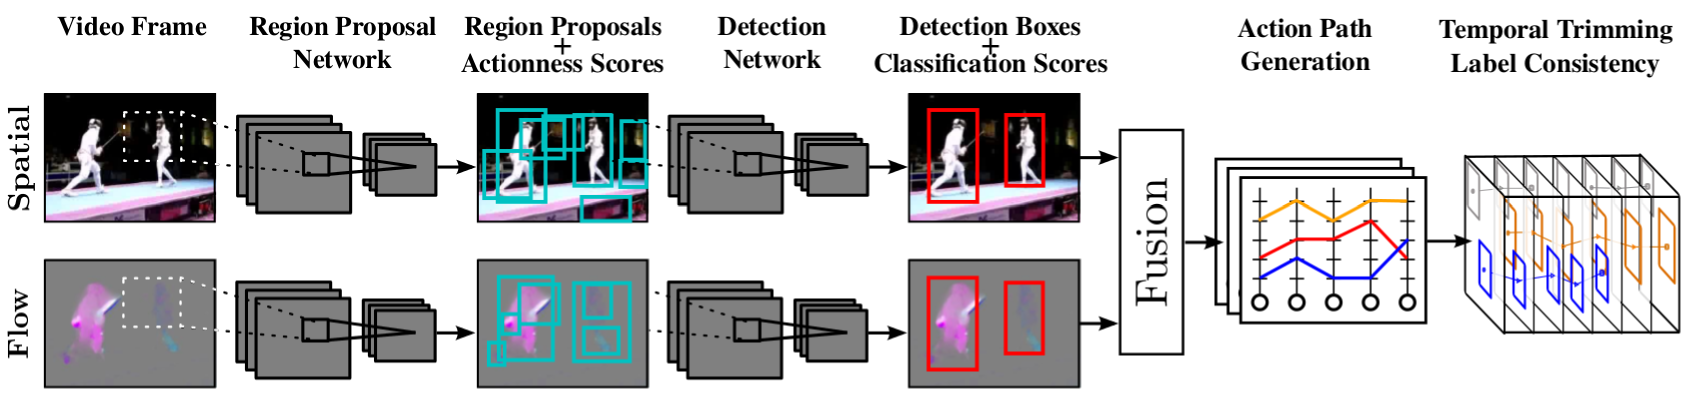
At test time, (a) RGB and flow images are passed to (b) two separate region proposal networks (RPNs). (c) Each network outputs region proposals with associated actionness scores. (d) Each appearance/flow detection network takes as input the relevant image and RPN-generated region proposals, and (e) outputs detection boxes and softmax probability scores. (f) Spatial and flow detections are fused and (g) linked up to generate class-specific action paths spanning the whole video. (h) Finally the action paths are temporally trimmed to form action tubes.
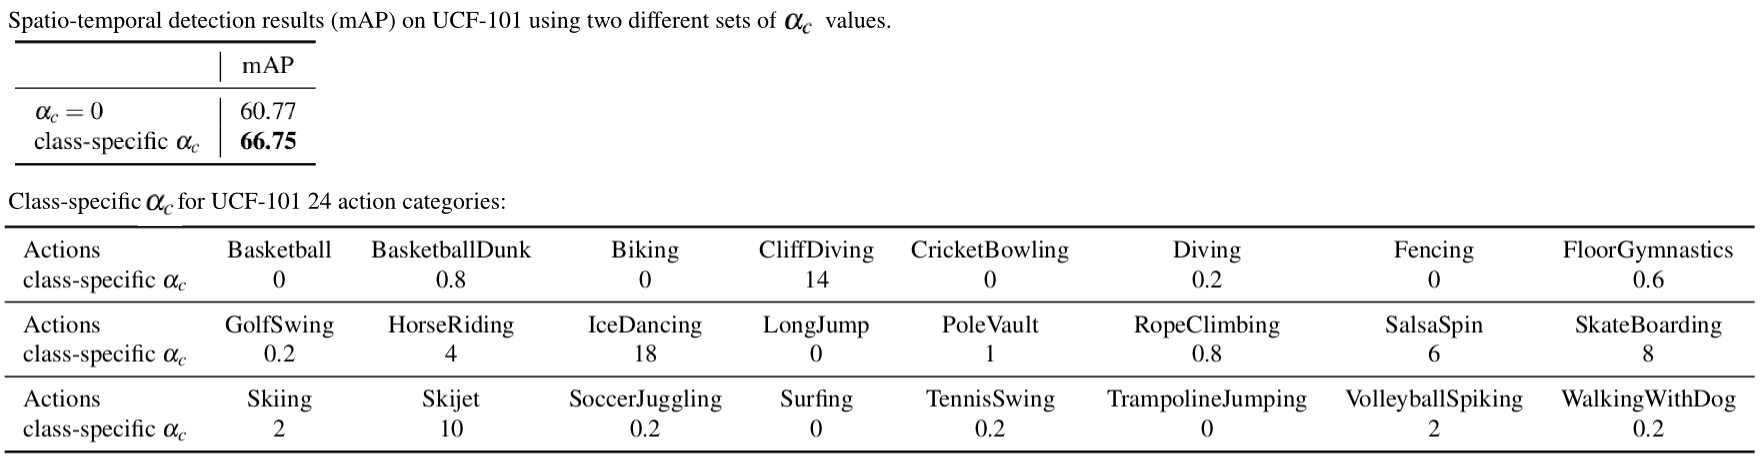
- For UCF101, we noticed that the optical flow based RPN and Fast-RCNN models trained using VGG-16 image-mean [123.6800, 116.7790, 103.9390] perform better than the flow models trained using flow image-mean [128.00, 128.00, 128.00]. For this reason, we trained our UCF101 flow-based RPN and Fast-RCNN networks using VGG-16 image-mean.
- New: There was a minor bug in the second pass DP code used for temporal trimming of action paths. We corrected the code and generated the evaluation results again on UCF-101 test spli1. As the videos of J-HMDB-21 are temporally trimmed, there is no need to generate the results again. The new evaluation results are shown in the table below. The new figures are almost the same as earlier results.
Table 1: Quantitative action detection results (mAP) on the UCF-101 dataset.
| Spatio-temporal overlap threshold δ | 0.05 | 0.1 | 0.2 | 0.3 | 0.4 | 0.5 | 0.6 |
|---|---|---|---|---|---|---|---|
| Yu et al. [2] | 42.80 | - | - | - | - | - | - |
| Weinzaepfel et al. [1] | 54.28 | 51.68 | 46.77 | 37.82 | - | - | - |
| Our (appearance detection model) | 67.56 | 65.45 | 56.55 | 48.52 | 39.00 | 30.64 | 22.89 |
| Our (motion detection model) | 65.19 | 62.94 | 55.68 | 46.32 | 37.55 | 27.84 | 18.75 |
| Our (appearance + motion fusion) | 78.85 | 76.12 | 66.36 | 54.93 | 45.24 | 34.82 | 25.86 |
Table 2: Quantitative action detection results (mAP) on the J-HMDB-21 dataset.
| Spatio-temporal overlap threshold δ | 0.1 | 0.2 | 0.3 | 0.4 | 0.5 | 0.6 | 0.7 |
|---|---|---|---|---|---|---|---|
| Gkioxari and Malik[3] | - | - | - | - | 53.3 | - | - |
| Wang et al.[4] | - | - | - | - | 56.4 | - | - |
| Weinzaepfel et al. [1] | - | 63.1 | 63.5 | 62.2 | 60.7 | - | - |
| Our (appearance detection model) | 52.99 | 52.94 | 52.57 | 52.22 | 51.34 | 49.55 | 45.65 |
| Our (motion detection model) | 69.63 | 69.59 | 69.49 | 69.00 | 67.90 | 65.25 | 54.35 |
| Our (appearance + motion fusion) | 72.65 | 72.63 | 72.59 | 72.24 | 71.50 | 68.73 | 56.57 |
Table 3: Quantitative action detection results on the LIRIS-HARL dataset (evaluation metric used: LIRIS HARL evaluation [5]).
We report space-time detection results by fixing the
threshold quality level to 10% for the four thresholds [5] and measuring temporal precision
and recall along with spatial precision and recall, to produce an integrated score. We refer
the readers to [5] for more details on LIRIS HARL’s evaluation metrics.
Abbreviations used in this table:
I-SR: Integrated spatial recall; I-SP: Integrated spatial precision;
I-TR: Integrated temporal recall; I-TP: Integrated temporal precision;
IQ: Integrated quality score.
| Method | Recall-10 | Precision-10 | F1-Score-10 | I-SR | I-SP | I-TR | I-TP | IQ |
|---|---|---|---|---|---|---|---|---|
| VPULABUAM-13-IQ [6] | 0.04 | 0.08 | 0.05 | 0.02 | 0.03 | 0.03 | 0.03 | 0.03 |
| IACAS-51-IQ [7] | 0.03 | 0.04 | 0.03 | 0.01 | 0.01 | 0.03 | 00.0 | 0.02 |
| Our (appearance + motion fusion) | 0.568 | 0.595 | 0.581 | 0.5383 | 0.3402 | 0.4802 | 0.4739 | 0.458 |
Table 4: Quantitative action detection results (mAP) on LIRIS-HARL for different δ (evaluation metric used: mAP [1]).
| Spatio-temporal overlap threshold δ | 0.1 | 0.2 | 0.3 | 0.4 | 0.5 |
|---|---|---|---|---|---|
| Appearance detection model | 46.21 | 41.94 | 31.38 | 25.22 | 20.43 |
| Motion detection model | 52.76 | 46.58 | 35.54 | 26.11 | 19.28 |
| Appearance+motion fusion with one DP pass | 38.1 | 29.46 | 23.58 | 14.54 | 9.59 |
| Appearance+motion fusion with two DP passes | 54.18 | 49.10 | 35.91 | 28.03 | 21.36 |
References
- [1] Philippe Weinzaepfel, Zaid Harchaoui, and Cordelia Schmid. Learning to track for spatio-temporal action localization. In IEEE Int. Conf. on Computer Vision and Pattern Recognition, June 2015.
- [2] Gang Yu and Junsong Yuan. Fast action proposals for human action detection and search. In Proceedings of the IEEE Conference on Computer Vision and Pattern Recognition, pages 1302–1311, 2015.
- [3] G Gkioxari and J Malik. Finding action tubes. In IEEE Int. Conf. on Computer Vision and Pattern Recognition, 2015.
- [4] Limin Wang, Yu Qiao, Xiaoou Tang, and Luc Van Gool. Actionness estimation using hybrid fully convolutional networks. In CVPR, pages 2708–2717, 2016.
- [5] C. Wolf, J. Mille, E. Lombardi, O. Celiktutan, M. Jiu, E. Dogan, G. Eren, M. Baccouche, E. Dellandrea, C.-E. Bichot, C. Garcia, and B. Sankur. Evaluation of video activity localizations integrating quality and quantity measurements. In Computer Vision and Image Understanding, 127:14–30, 2014.
- [6] Juan C. SanMiguel and Sergio Suja. Liris harl competition participant, 2012. Video Processing and Understanding Lab, Universidad Autonoma of Madrid, Spain, http: //liris.cnrs.fr/harl2012/results.html.
- [7] Yonghao He, Hao Liu, Wei Sui, Shiming Xiang, and Chunhong Pan. Liris harl competition participant, 2012. Institute of Automation, Chinese Academy of Sciences, Beijing http://liris.cnrs.fr/harl2012/results.html.
Action detection/localisation results on UCF101 dataset
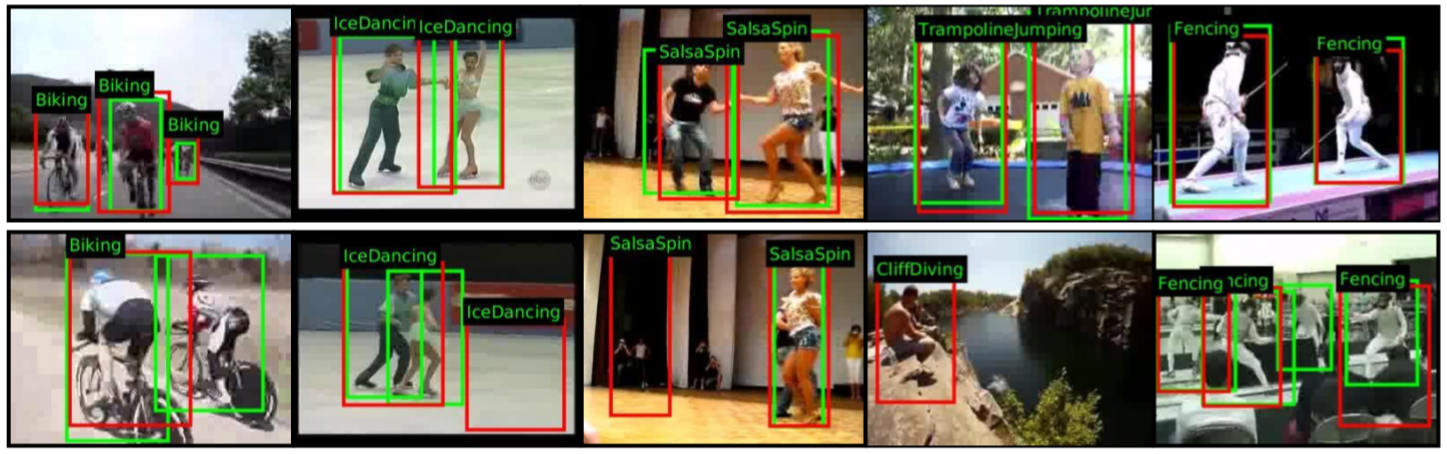
Ground-truth boxes are in green, detection boxes in red. The top row shows correct detections, the bottom one contains examples of more mixed results. In the last frame, 3 out of 4 `Fencing' instances are nevertheless correctly detected.
Sample space-time action localisation results on JHMDB-21 dataset
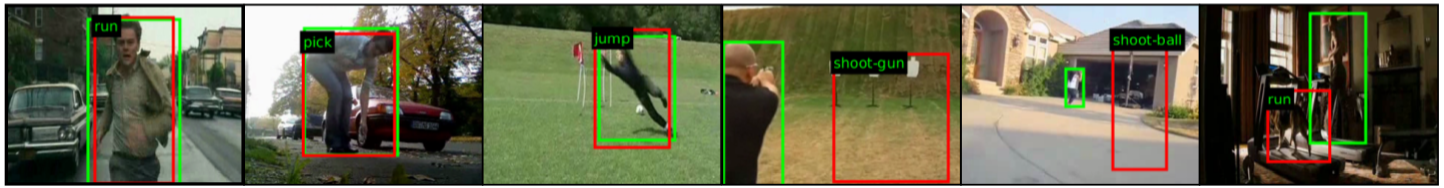
Left-most three frames: accurate detection examples. Right-most three frames: mis-detection examples.
Sample space-time action localisation results on LIRIS-HARL dataset
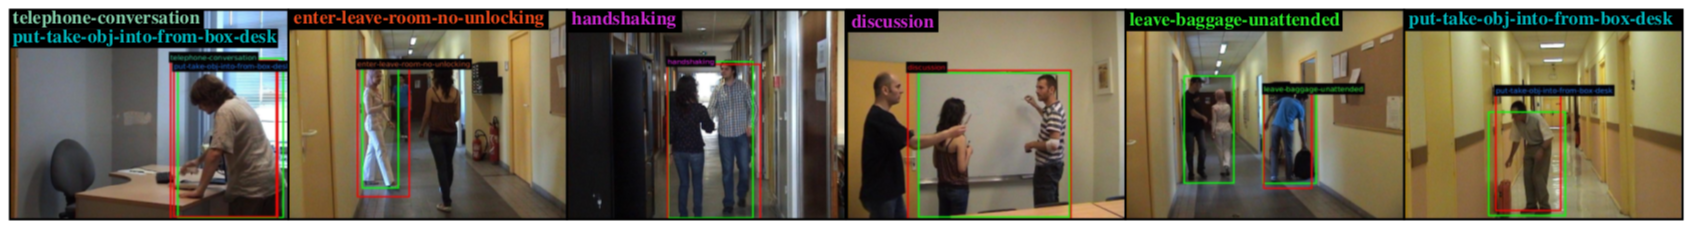
Frames from the space-time action detection results on LIRIS-HARL, some of which include single actions involving more than one person like ‘handshaking’ and ‘discussion’. Left-most 374 three frames: accurate detection examples. Right-most three frames: mis-detection examples.
Sample spatio-temporal localisation results on UCF-101
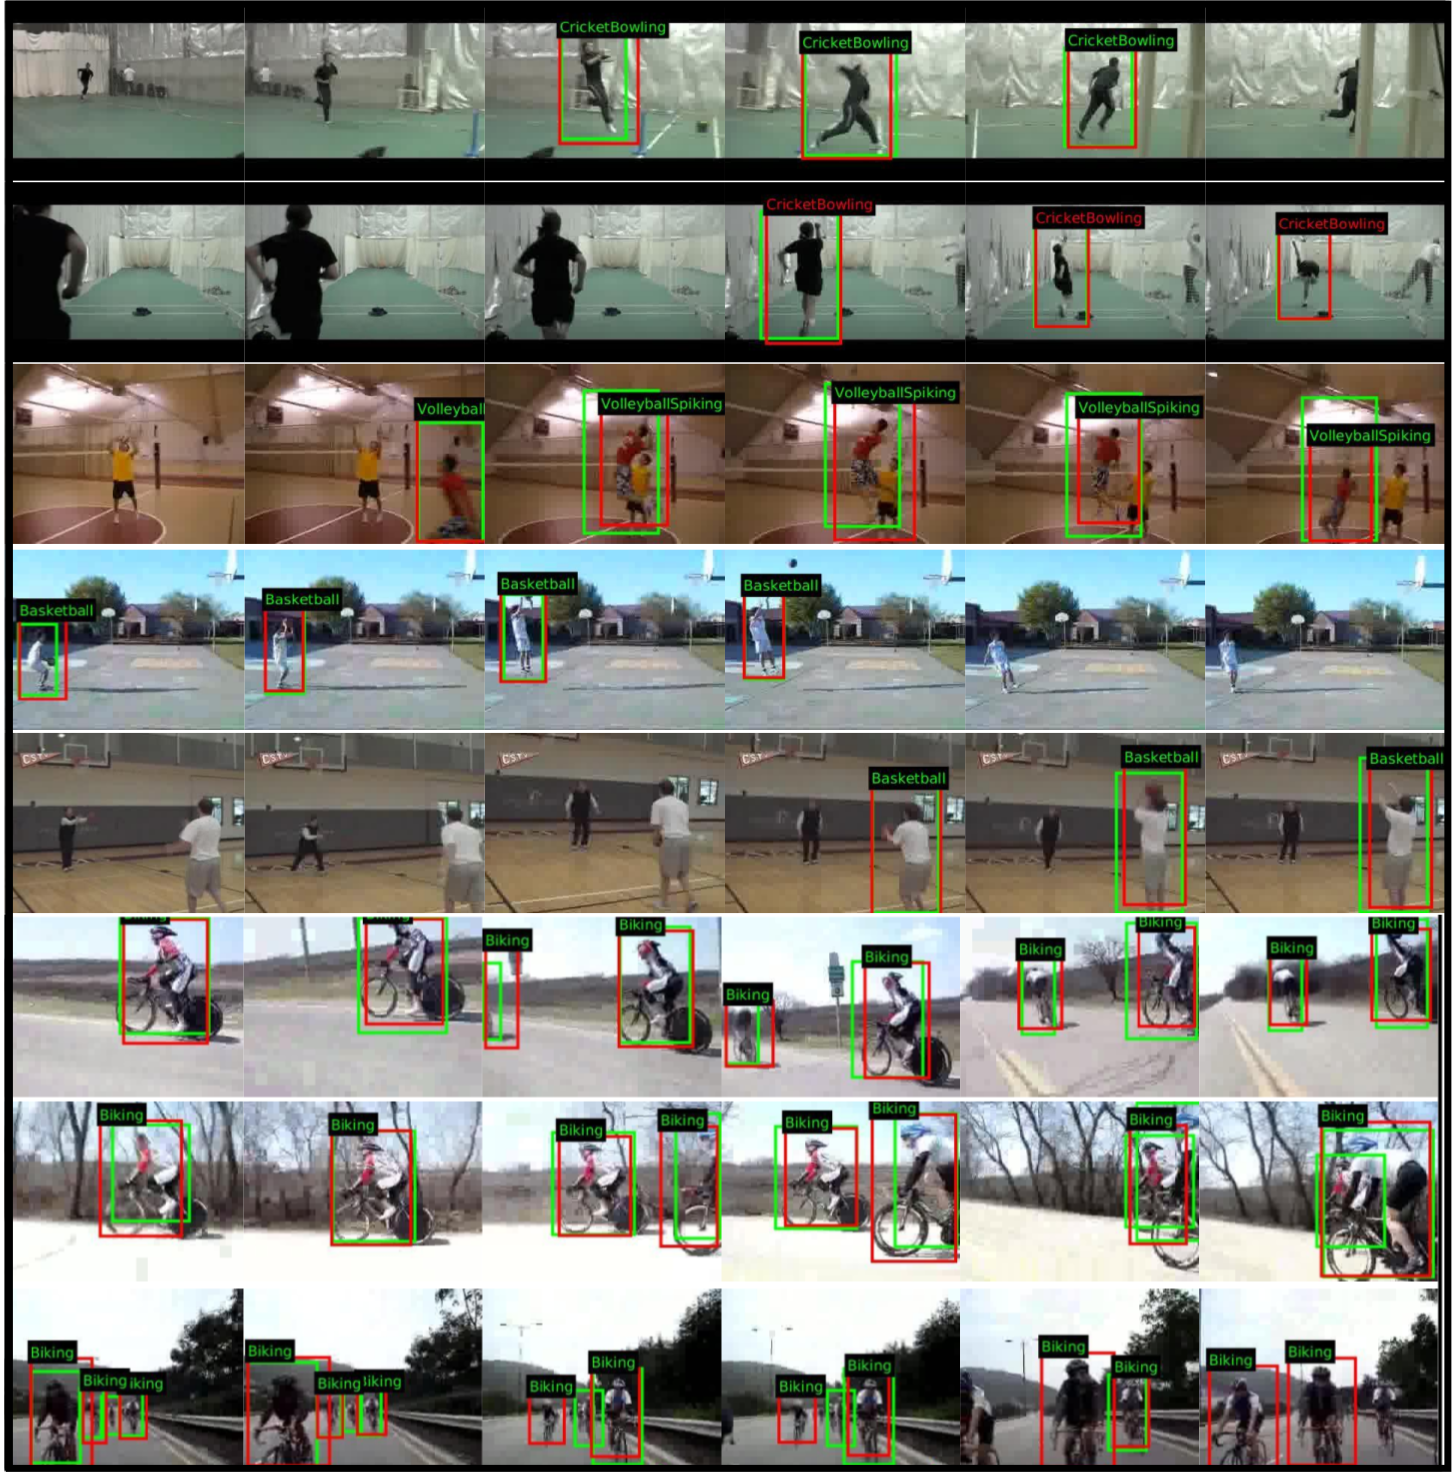
Each row represents a UCF-101 test video clip. Ground-truth bounding boxes are in green, detection boxes in red.
Selective Search vs RPN action proposals
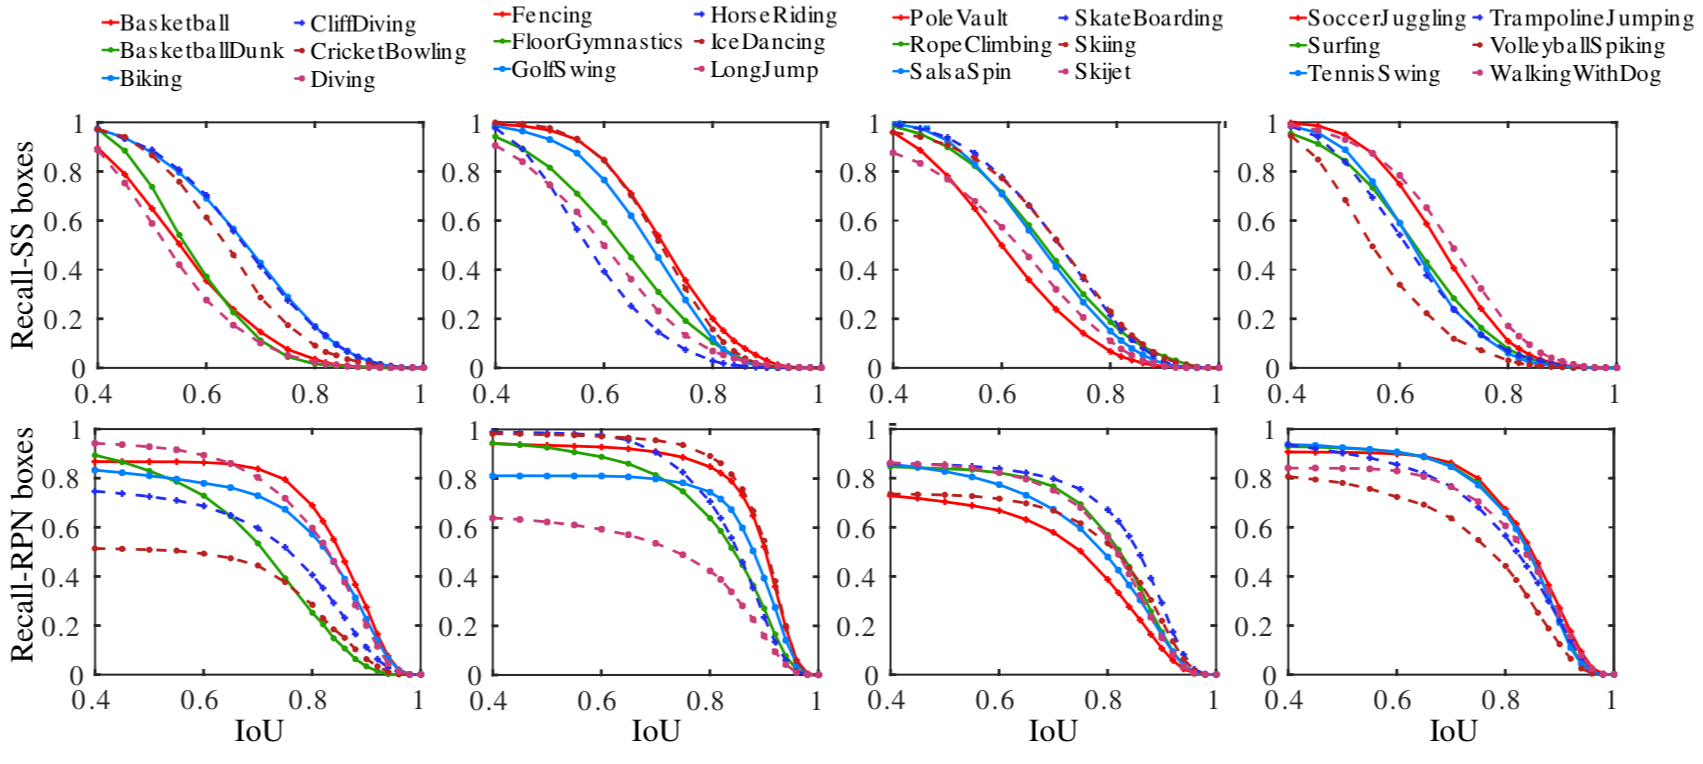
Performance comparison between Selective Search (SS) and RPN-based region proposals on four groups of action classes (vertical columns) in UCF-101. Top row: recall vs. IoU curve for SS. Bottom row: results for RPN-based region proposals.
Train/Test Computing Time
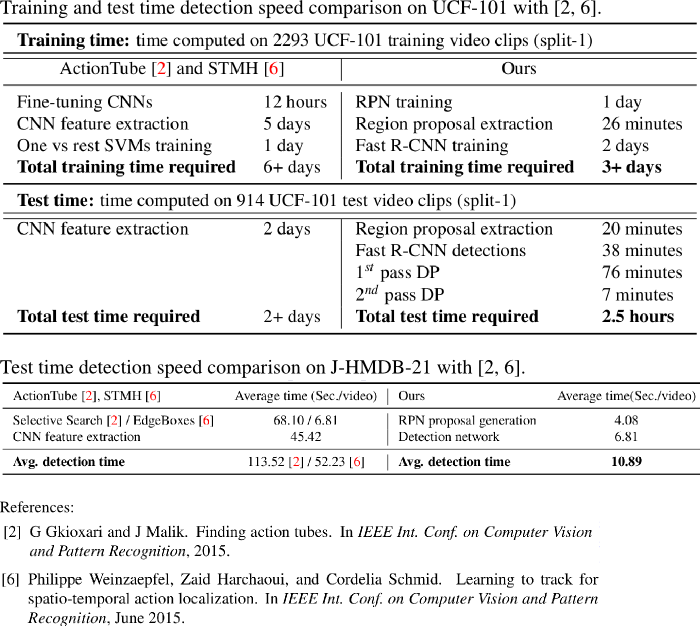
Note: that the reference numbers are in line with our BMVC2016 suplementary material.